ivia
hello@iviasolutions.inWhatsApp +91 86070 70505Meta · Google · Amazon · SEO · Creative
02Proven results

Real accounts. Real results.

Case studies are anonymized and shown as relative improvements. Every result is backed by a full implementation timeline and documented weekly action logs.

Live client data · Amazon

Actual Amazon Ads dashboards.

Real screenshots from active client Amazon Advertising accounts we manage. Identifying details removed.

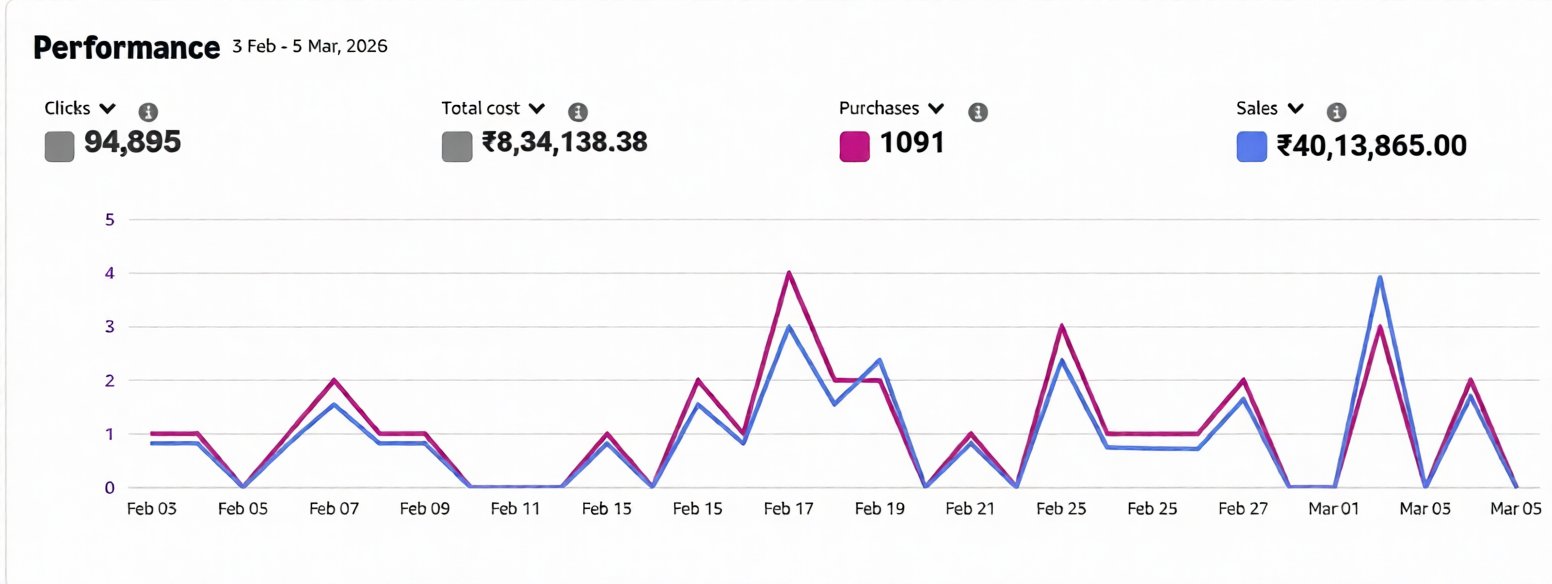
Client Account A · Amazon India

₹40.1L sales · 1,091 purchases · ₹8.3L spend

Feb 3 – Mar 5, 2026 · Full account management

4.81×ROAS
94.9KClicks
1,091Orders
Amazon Ads performance dashboard for Client Account A
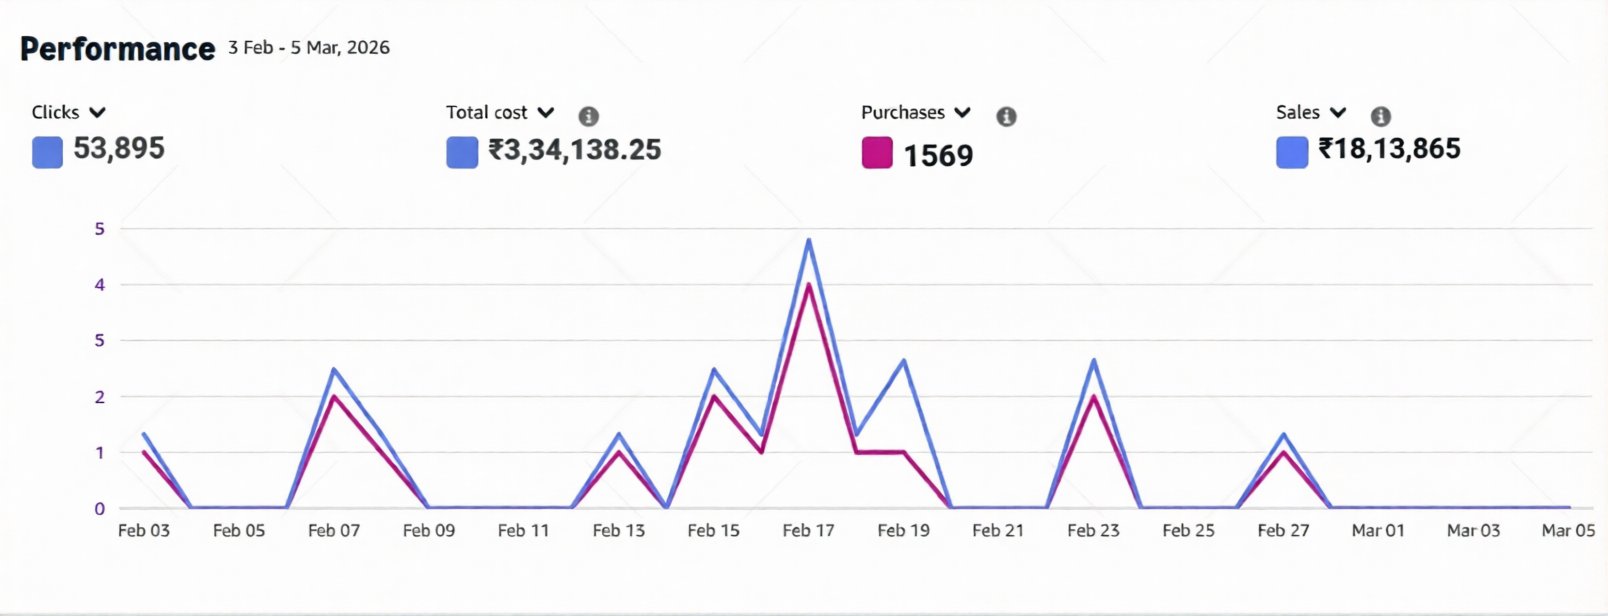
Client Account B · Amazon India

₹18.1L sales · 1,569 purchases · ₹3.3L spend

Feb 3 – Mar 5, 2026 · Full account management

5.42×ROAS
53.9KClicks
1,569Orders
Amazon Ads performance dashboard for Client Account B
Marketplace case studies

Different accounts, different problems.

No two accounts fail the same way. These Amazon case studies cover the most common structural problems, and how we solved them.

Amazon · Home Lighting · India

44% ACOS reduction via a full restructure

18 SKUs sharing the same campaigns, zero negative keyword management and 22% of spend on irrelevant search terms. ACOS stuck at 68–72%.

Key insightArchitecture before optimization. Patching a broken account rarely works.
70→39%ACOS
48→31%TACOS
22→6%Wasted spend
+9Page-1 keywords
Amazon · Pet Supplies · India

80% revenue scale without increasing ACOS

The auto campaign had been paused for “high ACOS”, removing the brand's main discovery engine. The same 35 keywords had run since launch.

Key insightPausing auto is almost never the answer. Pre-load negatives and manage it properly.
+80%Revenue
41→38%ACOS
35→112Keywords
+18%ASIN target revenue
Amazon · Skincare D2C · India

12 page-1 keywords in 75 days, from zero

A brand-new listing with 0 reviews and 0 organic rank, competing with established players. Conversion rate at launch was 4%.

Key insightMid-competition keywords plus Vine coordination compress launch timelines significantly.
0→12Page-1 keywords
65→28%TACOS
4→11%CVR
0→35%Organic share
Amazon · Multi-SKU Portfolio · India

35% TACOS reduction across 40+ ASINs in 90 days

Four years of unstructured growth: 110+ campaigns, no naming conventions, duplicate keywords. SKU-level analysis revealed 30% of spend funding negative-margin products.

Key insightBlended ACOS hides the truth. SKU-level profitability analysis is non-negotiable at scale.
31→20%TACOS
+48%Hero SKU revenue
₹80KRecovered / month
110→58Campaigns

Meta, Google & beyond

How we measure success.

Platform dashboards each grade their own homework. On Meta and Google we report against three numbers that can't double-count, with targets agreed in writing before launch.

MER

Total revenue ÷ total spend

Marketing efficiency across every channel combined. It cannot double-count, which makes it the number budget decisions are made on.

Breakeven ROAS

1 ÷ margin

The floor every campaign is judged against. With a 40% contribution margin, anything under 2.5× is losing money on the first order.

New-customer CAC

Spend ÷ new customers

What each genuinely new customer costs, and how long their repeat purchases take to pay it back.

Let's talk

Your account could be next.

Start with a free growth audit. We'll show you exactly what's holding your accounts back, and what the path to improvement looks like.